The project that’s most dear to my heart is the problem of auto-picking, or automating the process of interpreting ice-penetrating radar data. I spent years during my time in Austin working as a lab tech for a group of geophysicists who had an enormous amount of this radar data and needed someone to “pick” it.
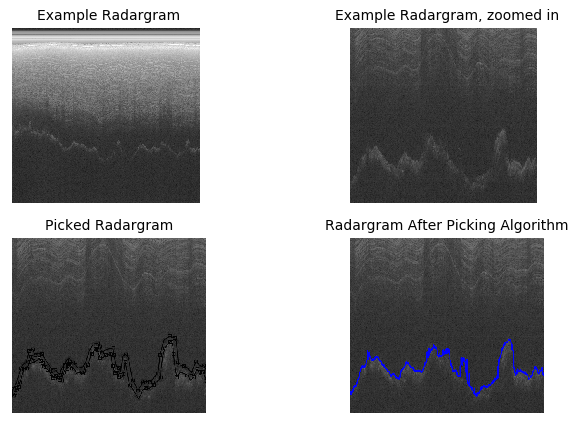
This human-powered picking is simple enough, really. You load up a radar image, draw the upper and lower boundaries of your feature of interest (the surface or bottom of the ice), and then run an algorithm that finds the strongest signal within those boundaries.
Before we dive into the benefits of auto-picking, let’s talk about what is actually going on in a radar image!
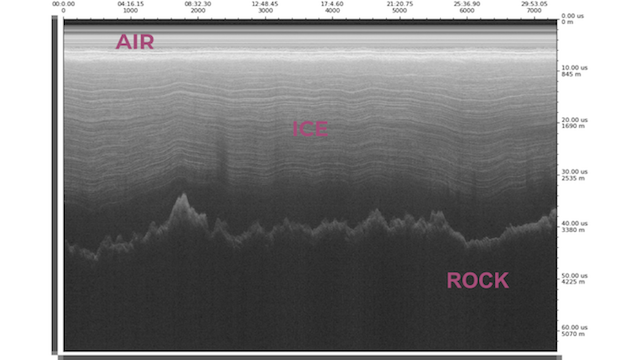
The radargram above is from the interior of Antarctica, so we can make out air, ice (plus a bunch of ice layers!), and rock. The surface of the ice is the bright, stable line near the top of the image (right below the word AIR). The bottom of the ice is the kind of jagged, bright region underneath the ice layers and above the darkness. These two features are what I want to use automation to detect.
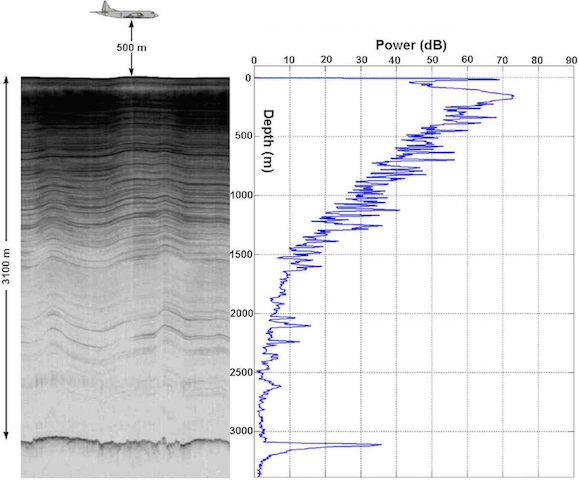
So how do we even get these images in the first place? Radar (plus other) equipment is mounted on an airplane (although there’s recently been a push to mount the equipment on helicopters and drones) and then chirps, or transmits pulses, throughout the flight, listening for reflected energy. We can then convert the radar signal into an image, where each column of the image represents the returned signal (see the figure below, from (1)). It’s tempting at first to think of the axes of a radar image as spatial coordinates, which isn’t necessarily wrong, but if we want to be precise, the x-axis represents the transmission time of each radar pulse and the y-axis represents the time delay of each record.
Anyway, back to the problem of auto-picking!
I said earlier that the picking process is simple, which is often true. But let’s get one thing straight: it is time consuming. Geophysicists have been getting a whole lot better at the whole data collection process, and will only get more efficient once they start deploying drones. And once a radargram is picked, it will be reprocessed and then picked again. Picking isn’t an unpleasant task (who doesn’t like being almost certainly the first/only person in the world to see neat features like volcanic ash plumes and subglacial lakes?!), but wouldn’t it be nice if geophysicists could collect their radar data and not have to wait months to actually do cool science with said data?
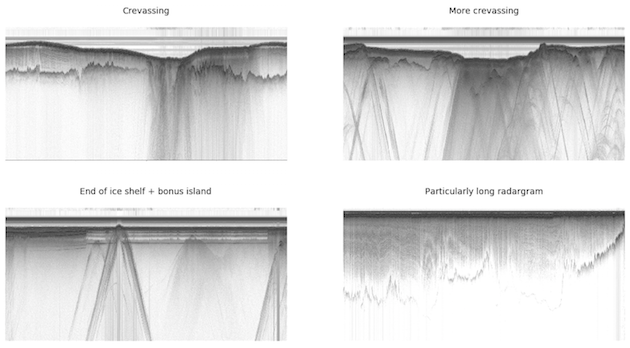
In addition to the time consuming nature of the picking process, sometimes radar data can be extremely messy, which can lead to… interesting interpretations when picked by people of varying levels of comfort with radar image analysis. Often the radar will reflect off a surface that is not the bottom of the ice (like water, buildings, crevasses, ice shelf edges) and it can be incredibly difficult to determine what’s a reflection and what’s the bed. I’m quite possibly The Leading Expert on analyzing radar images but back when I was a beginner I definitely made the mistake of determining that a reflection of the ocean’s surface was actually bedrock.
The most obvious application of radar data is determining how thick ice is, but we can use it to gather so much more useful information! We can determine the roughness of the underlying bedrock, track changes in the grounding zone (where ice changes from being grounded to floating on water), and detect and characterize subglacial water (did you know that subglacial swamps are a thing??). (3)
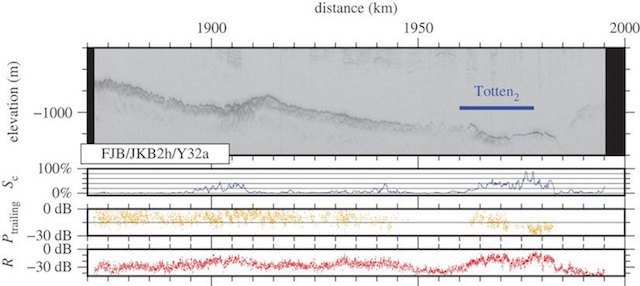
Detecting subglacial water is especially important because it allows geophysicists to better understand the melt risk for glaciers with a lot of sea level potential. (4) There are several methods for subglacial water detection, but generally we use the basal reflectivity and specularity of the bed. (2) These values cannot be computed until the radargram has been picked (as we need to know where the bed actually is).
Now that you know a little bit about ice radar and what we can learn from it, I hope you’ll share my enthusiasm for auto-picking! This project is still very much a work in progress, but I’ve learned a lot from it so far and I’m looking forward to sharing that knowledge with you in the future!