Hey y’all! Today I want to talk a little bit about a project from my introductory database/SQL class. We spent the semester learning how to build/clean/query a database containing Airbnb and Zillow data from the city of Austin, and then at the end of the semester we were left to our own devices to visualize the data and find something interesting to present to the professor and TAs. I’m not going to dive into the details of the entire project but I do want to share an insight that I thought was pretty cool!
If you’re familiar with Austin, you’re probably aware that there are two large annual festivals that draw a lot of visitors to the city: South by Southwest (SXSW) and Austin City Limits (ACL). As someone who lived in Austin for a decade, my “local intuition” suggested to me that these festivals drive up demand for short term housing enough that there should be a noticable uptick in the prices of Airbnb properties during the months these festivals occur.
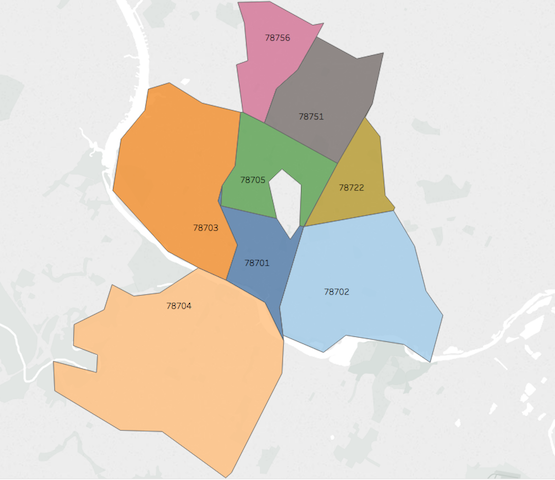
In order to make my plots a little bit easier on the eyes, I grouped the Airbnb listings by zip code and limited my visualization to the eight central zip codes you see above. To give yourself a frame of reference, the blank area in the middle is the University of Texas at Austin campus. 78701 encompasses downtown. ACL takes place at Zilker park, which is in the 78704 zip code. SXSW is much more spread out than ACL, taking place primarily in the 78701, 78702, and 78704 zip codes.
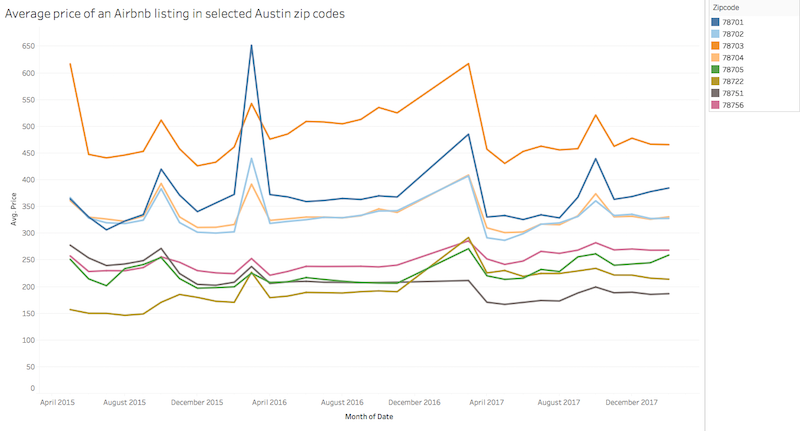
Once I had selected my zip codes of interest I went ahead and plotted my data! First I looked at the price of all listings for each day from May 1, 2015 to February 28, 2018, and averaged it out by month. Each year in March and October there was a noticeable spike in the average listing price. I plotted the data again, this time using the median price, and still saw noticeable spikes for the month of March, and smaller or no spikes for the month of October.
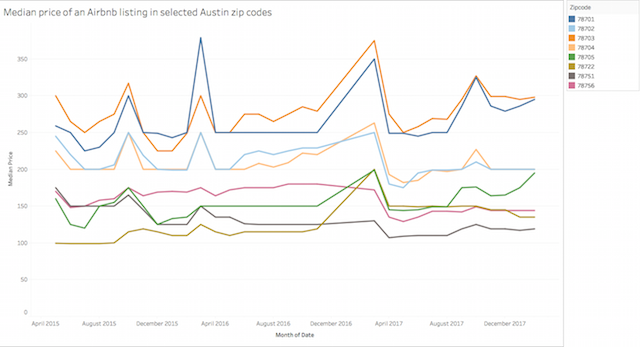
While the above plots provide evidence that I’m probably on to something with my local intuition, they don’t provide the whole story! I looked at the prices for every listing, whether it was rented out or not. If I looked more closely I might see that listings with particularly high price increases didn’t actually get rented out. I also might have made some better insights if I’d grouped by neighborhood, rather than by zipcode.
Most of the SQL used for this project is on my repo, but an example of a query used to pull the data used for these plots is:
SELECT date_trunc(date, MONTH) as date, zipcode, AVG(price) as average_price
FROM `spooky-data-seance.austin.results_20180628_152848`
WHERE zipcode IN (78701, 78702, 78703, 78704, 78705, 78722, 78751, 78756)
GROUP BY zipcode, date
ORDER BY zipcode, date;
I think at this point it is safe to say that SXSW and ACL do have some effect on the price of Airbnb listings in central Austin zipcodes, but I can’t really say anything more specific than that based on such a quick and dirty analysis. If I ever move back to Austin, though, it might be worth diving a bit deeper into the data to see if it’s worth renting out my house during festival season. :)